Introduction
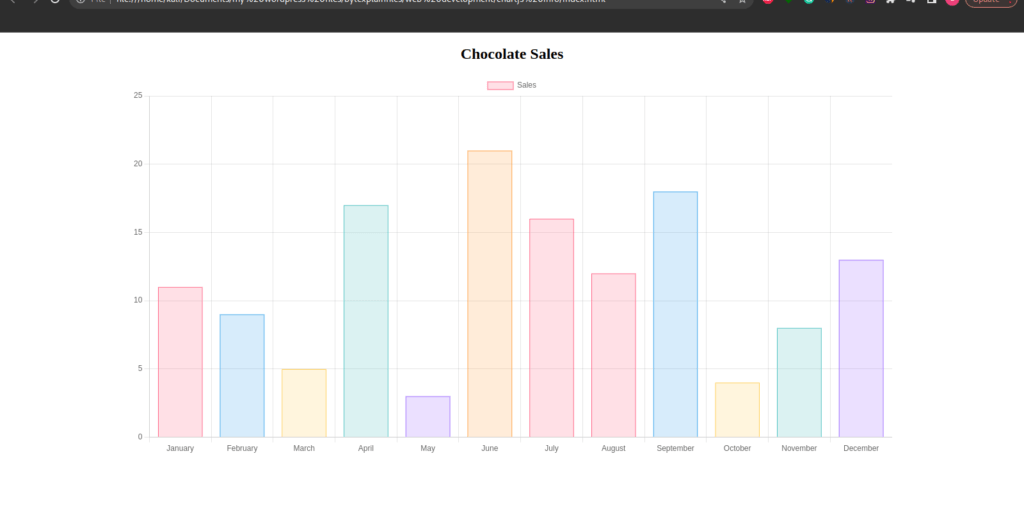
Chart.js is a popular JavaScript library for creating interactive and responsive data visualizations in web applications. It provides a simple and flexible API for creating a wide range of chart types, including line charts, bar charts, pie charts, scatter charts, and many more. In this tutorial, we will be creating a bar graph to display chocolate sales throughout the year.
Table of Contents
File structure
Create a simple folder and name it chocolate and inside it create a file called index.html. Inside the html template enter the code below.
<!DOCTYPE html>
<html>
  <head>
    <title>Chart.js Example</title>
    <script src="https://cdn.jsdelivr.net/npm/chart.js"></script>
    <style>
      canvas {
        display: block;
        margin: auto;
        width: 75%;
      }
    </style>
  </head>
  <body>
    <h2 style="text-align:center";>Chocolate Sales</h2>
    <canvas id="myChart"></canvas>
    <script>
      const ctx = document.getElementById('myChart').getContext('2d');
      const myChart = new Chart(ctx, {
        type: 'bar',
        data: {
          labels: ['January', 'February', 'March', 'April', 'May', 'June', 'July','August','September','October','November','December'],
          datasets: [{
            label: 'Sales',
            data: [11, 9, 5, 17, 3, 21, 16,12,18,4,8,13],
            backgroundColor: [
              'rgba(255, 99, 132, 0.2)',
              'rgba(54, 162, 235, 0.2)',
              'rgba(255, 206, 86, 0.2)',
              'rgba(75, 192, 192, 0.2)',
              'rgba(153, 102, 255, 0.2)',
              'rgba(255, 159, 64, 0.2)',
              'rgba(255, 99, 132, 0.2)'
            ],
            borderColor: [
              'rgba(255, 99, 132, 1)',
              'rgba(54, 162, 235, 1)',
              'rgba(255, 206, 86, 1)',
              'rgba(75, 192, 192, 1)',
              'rgba(153, 102, 255, 1)',
              'rgba(255, 159, 64, 1)',
              'rgba(255, 99, 132, 1)'
            ],
            borderWidth: 1
          }]
        },
        options: {
          scales: {
            yAxes: [{
              ticks: {
                beginAtZero: true
              }
            }]
          }
        }
      });
    </script>
  </body>
</html>
Save the code and open the index.html file using the browser and you should see the graph rendered in the canvas outlined above.
Results
Thanks for reading. Happy coding.